ETC Staff monitor and collect data from several hundred weather stations - many on our own project sites. Most every month we are recording data that we ultimately label, “[X] in recorded history” - [highest wind speed], [coldest temp], [hottest temp], [most rainfall in some period of time], …

These extreme weather conditions are rapidly altering the averages … establishing new weather normals. For our home office location - 15 years ago the average rainfall was only 2.4″ annually, yet today, the national weather bureau reports the average annual precipitation is now 6.92″. In analyzing weather data for our orchards and our mineral operations sites, it is obvious that these new highs are happening at ever faster rates. That is, we are looking at hundreds of hockey stick graphs for ever higher temperatures, ever higher winds and new record precipitation - historic weather records commonly breaking recent historic weather records.
While we recognize that climate cycles are based on a long list of variables - CO2 and other gas levels in our atmosphere, sun spots, seismic activity, wobble of the earth’s rotation, even the position of our solar system within the Milky Way galaxy - many of our project sites have weather data dating back over 200 years. Yet this massive amount of weather history is proving to be insufficient to enable us to predict our near future conditions. Weather is critical to most every aspect of our business - orchards, mineral processing, transportation and aviation. Our in-house meteorologist is now researching the ocean temperatures, ice cores, projected climate trends from university models covering eons, trying to support our efforts in these times of new normal weather extremes.
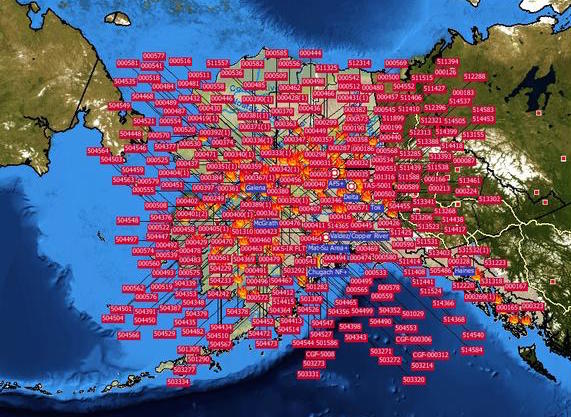
Take a close look at these 2 images - our planet above and the State of Alaska below. The earth image shows the highest count of tropical storms ever photographed at once (the date is at the bottom). Each of those white swirls are massive storms - the result of the highest ocean temperatures in recorded history. These higher temperatures are causing more rainfall on land mass - as we are experiencing in the southern Nevada, USA region.
This second image shows the simultaneous wild fires in the State of Alaska. This is the highest count of wildfires in recorded history - yet a another hockey stick graph. Statistically, these extremes are our new normal.

